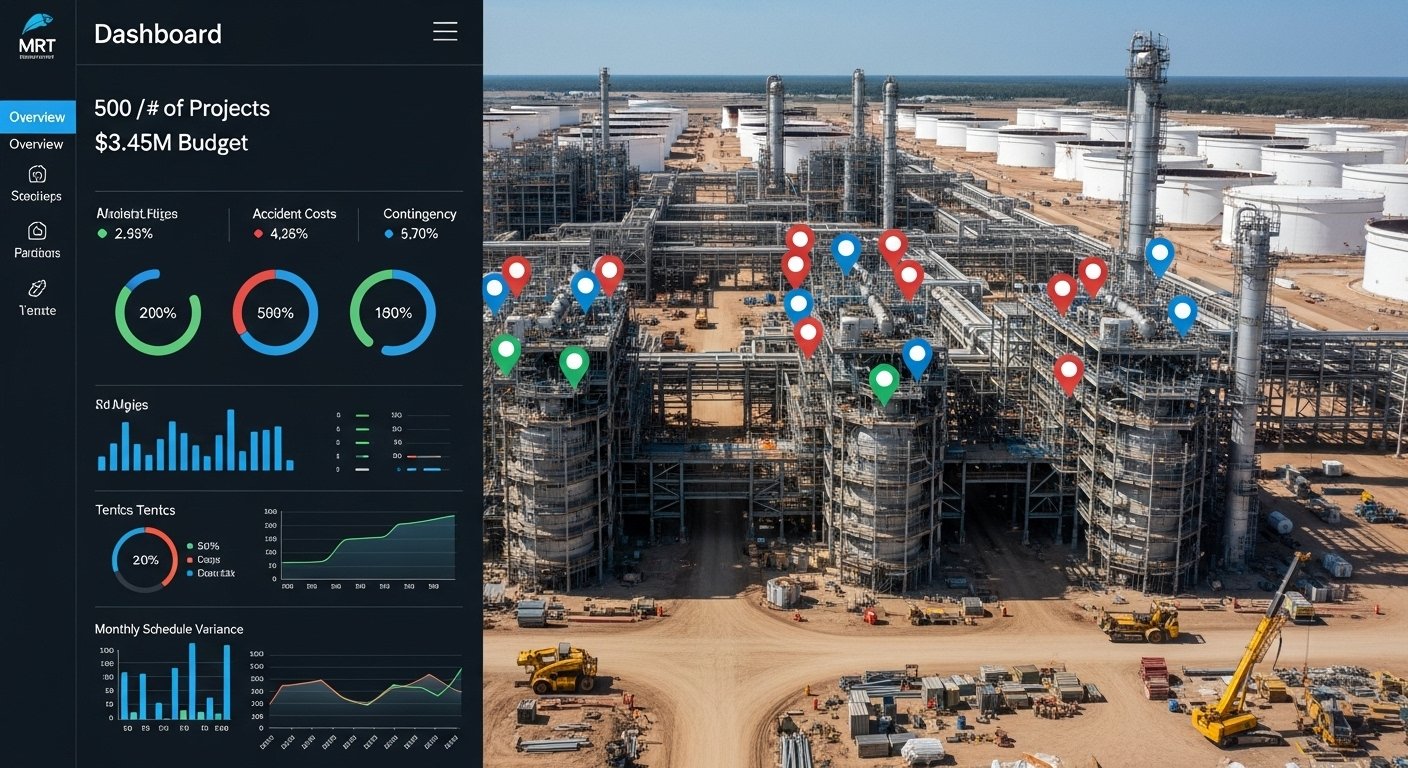
Real-Time Intelligence. Live in Power BI.
MXI’s Power BI dashboards deliver continuously updated project intelligence derived from verified field data — giving owners and legal teams a live, defensible view of project performance.

Custom Power BI Dashboards Built on Verified Field Data
MXI dashboards are not built from contractor reports or system-generated estimates. Every data point displayed is field-verified, timestamped, and traceable to a direct field observation.
Real-time data tracking — continuously updated from verified field audits, not self-reported contractor progress
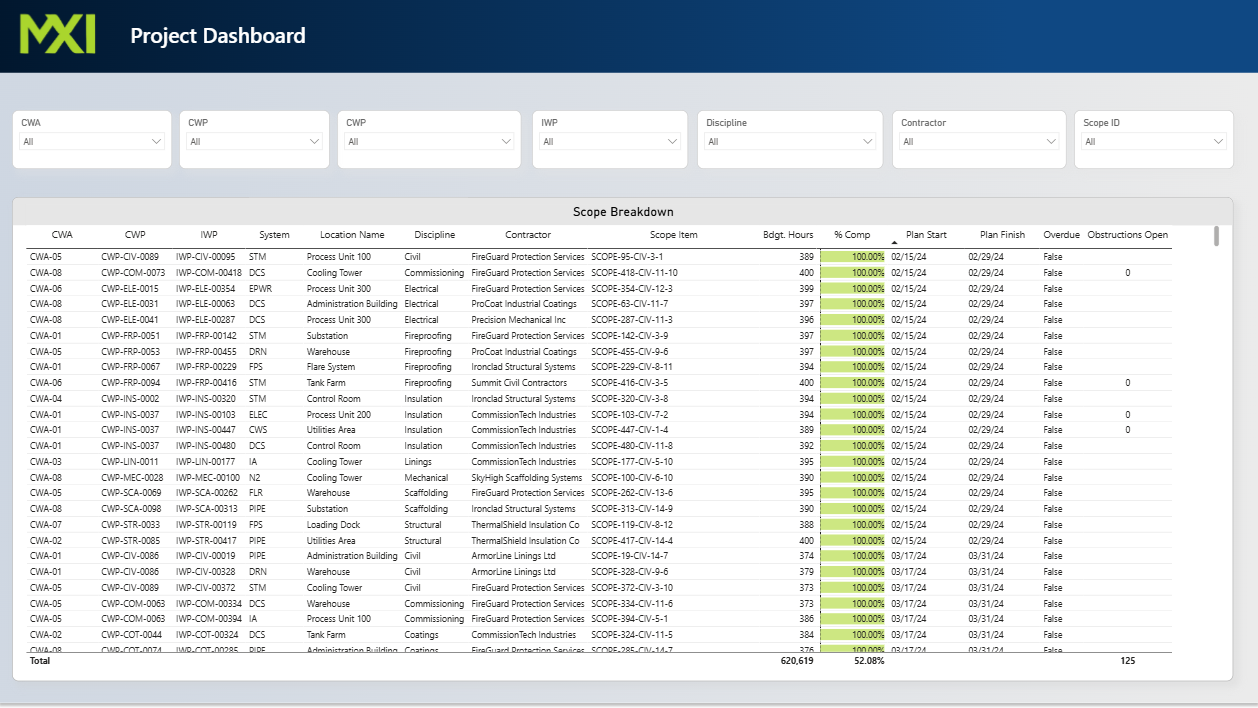
Interactive visual exploration — filter by trade, area, or schedule activity to isolate performance trends and anomalies
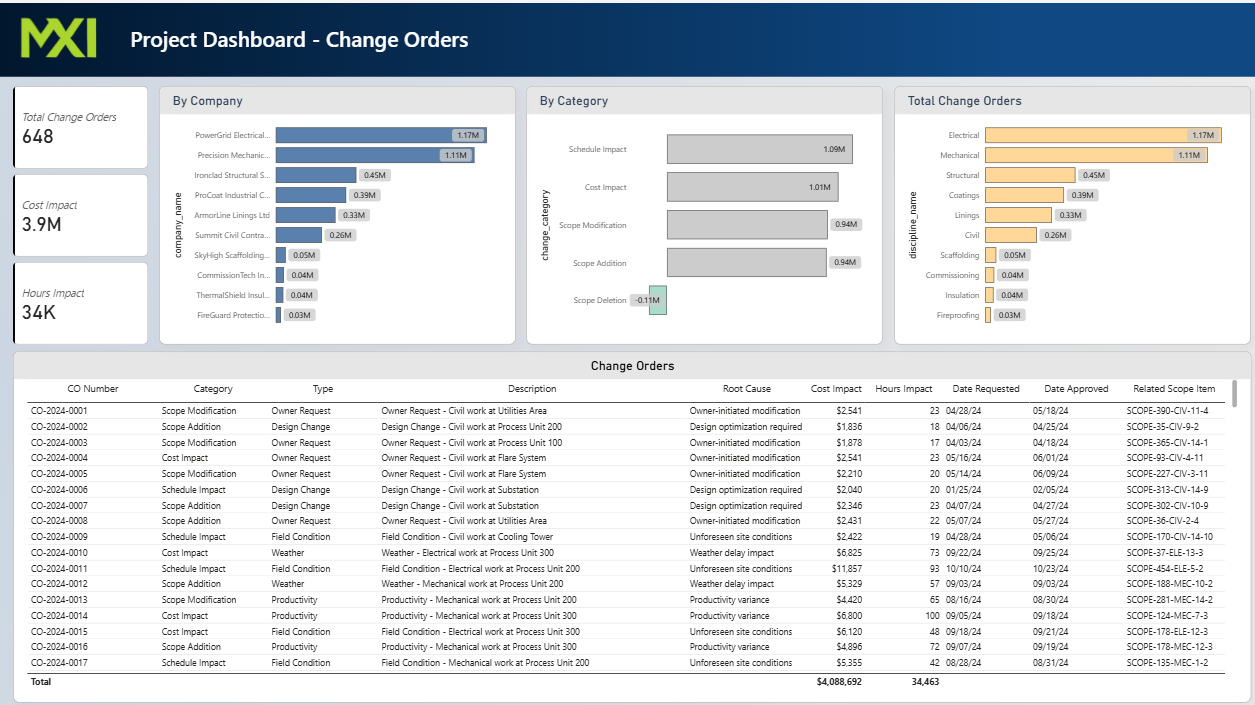
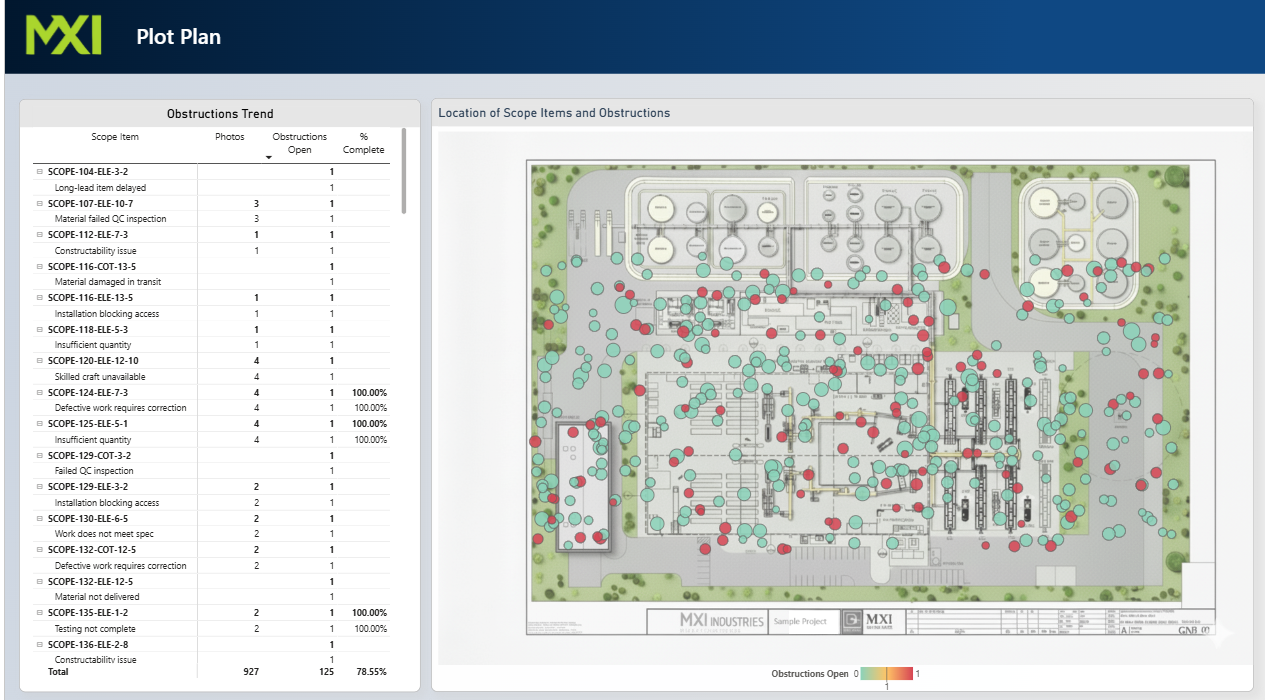
Comprehensive analytics — productivity rates, obstruction trends, delay patterns, and earned value in a single view
One View Across All Trades and Sites
MXI’s data environment consolidates field verification results, obstruction logs, submittal timelines, and earned value metrics into a unified, continuously updated dataset — accessible to owners and legal teams.

Performance Benchmarking and Anomaly Detection
Active project performance is measured against baseline schedules, historical norms, and contractual milestones. Deviations are flagged immediately — documented before they become disputes.
Six Core Dashboard Capabilities
Every MXI dashboard module is purpose-built to surface the specific intelligence owners and legal teams need — schedule deviation, labor productivity, obstruction patterns, and earned value — in a single live environment.
Real-Time Progress Tracking
Live dashboards showing installed quantities, earned value, and production rates by trade and area — sourced exclusively from MXI field audits, not contractor self-reports.

Multi-Source Data Integration
Primavera P6 schedules, RFI logs, submittal registers, procurement records, and delivery documentation are cross-referenced with verified field observations — identifying causal chains, impact sequences, and documentation gaps in real time.
Forensic Delay & Obstruction Analytics
Performance benchmarks against contracted baselines, approved schedules, and prior reporting periods — with automated flagging of deviations for immediate documentation before contractor self-reporting can obscure causation.
Direct Field Observation & Capture
MXI field teams physically measure installed quantities, document active trade crews, and capture obstruction events in real time — all entered directly into the MXI data environment at the point of observation. No contractor-provided data enters the pipeline.

Normalization, Cross-Reference & Validation
Raw field inputs are normalized against Primavera P6 schedule activities, RFI registers, submittal logs, and procurement documentation to produce a unified, independently validated dataset — with zero contractor input or influence in the aggregation process.

Owner-Tailored Visualization & Live Delivery
MXI engineers interactive Power BI dashboards configured to the owner's specific reporting requirements — delivered live, updated continuously as new field data is captured, and structured for export as forensic exhibits when disputes arise.